
| Time duration | November 2010 to March 2011 |
| Location | Pakistan |
| Organization | Ghulam Ishaq Khan Institute for MOL Pakistan |
| Project | Remote Surveillance & Control of Cross-Country Liquid Hydrocarbon Transmission |
| Position | Project Team Lead |
[CE 1.1]
This career episode relates to project titled“Remote Surveillance & Control of Cross-Country Liquid Hydrocarbon Transmission’’. The project was carried out for MOL Pakistan.
[CE 1.2]
In lieu of the growing crude oil supply projections from its Northern fields situated in Khyber Pakhtunkhwa (KPK) region, MOL Pakistan Oil and Gas Company B.V in collaboration with the national oil and gas company of Pakistan OGDCL, intended on laying a pipeline for the transportation of oil from KPK to Attock Oil Refinery Limited (ARL) in Rawalpindi, with a total length of around 250 KM. The pipeline already in place was old and not able to handle the envisioned throughput capacity of 56000 bpd.
NOTES:
[CE 1.3]
The foremost objective of the project was to design a pipeline system, counting all instrumentation and valve assemblies, to be remotely monitored and operated over fiber optic cables
Following were the deliverables of the project -
[CE 1.4]
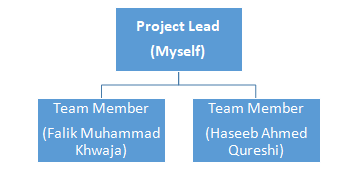
The project Hierarchy is given below -
[CE 1.5]
As the team lead, I was accountable for:
As the team member, I was responsible for
[CE 1.6]
Being a university student, I was unaware of the Oil and Gas industry standards and protocols being used for determining the selection of instrumentation devices. This was the first problem where I had to study the old systems in place and understand the complete working of a system that the Company wanted to replace. After a difficult process of gathering all technical data sheets from their office and field staff, I developed in-depth knowledge of the installed systems. I developed the current vendor list the Company was using and approached the vendors for their updated technology brochures and data sheets for further information.
Second challenge was to develop a miniature prototype of a 250 KM pipeline in lab and simulate control loops of the plausible flow conditions at site. I had to make a lot of alterations to the instrumentation devices provided to us by the Company for measuring flow, pressure and temperature. Since the actual flow could not be simulated in lab I had to install additional pumps to match the flowrates. In other control loops the pressure and temperature conditions were modified to represent changing conditions at site, for instance, a small pressure drop of 10 psi was designed to trigger an alarm depicting 500 psi drop on field (in case of crude theft from pipeline).
The biggest challenge however was the lab simulation for the optical system designed which meant selecting a new software for the project and learning it along the way. I had to ensure to select a software that would have fast throughput and communication speeds given the nature of the product (crude oil) being handled
[CE 1.7]
I selected Optisystem lite software on grounds of many benefits in comparison to the other software in market including free trial version for students like myself for quick learning. Below is the schematic of the final optical system designed using Optisystem Lite.
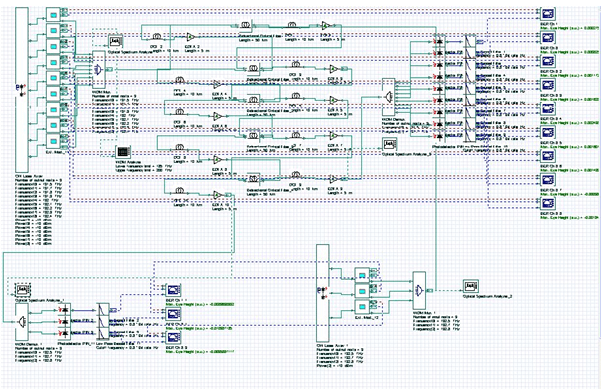
Fig: OPTICAL SYSTEM LAYOUT USING OPTISYSTEM LITE
I designed the simulation system for the optical system using the software Optisystem Lite. The above figure is a layout of the optical system I designed with nine inputs from sensor heads to the central control room (CCR) and control signals from CCR to the final control elements on field. The system comprised of wavelength division multiplexing technique. Signals from the field were wavelength division multiplexed and added onto a single fiber which is then carried on to the CCR.
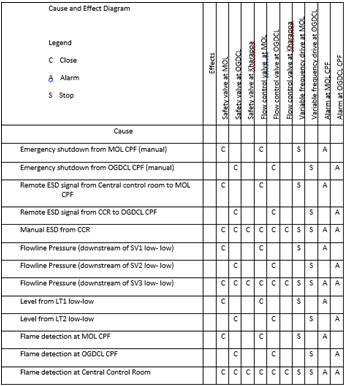
Another thing I designed was the cause and effect diagram of our project which enabled us to develop the control loops for different field flowing conditions. To design this, I went through extensive study sessions with the actual field crew at the Company’s office to understand the different situations that could trigger alarm. Below isthe abridged version of the C&E diagram.
CAUSE AND EFFECT DIAGRAM FOR CONTROL LOOPS
[CE 1.8]
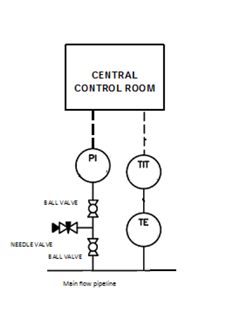
I also designed the control loops for the Central Control Unit. The Central control unit was where all operations were carried out from with a PLC. On the main flow pipeline, I connected two ball valves and a needle valve, this combination of valves allowed pressure to be measured within the pipeline without allowing any backflow of the liquid being transported. A pressure indicator measured the pressure and sent the pressure value as a 4-20mA signal towards the central control unit. On the main flow pipeline, I placed a Temperature Sensing Element which measured the temperature of the fluid and sent the value to a Temperature Indicating Transmitter which again sent the 4-20mA output to the Central Control Unit. The Central Control Unit constantly monitors these values and detected any extreme values raising an alarm or doing a complete shutdown of the pipeline if the values were off limits.
PRESSURE AND TEMPERATURE CONTROL LOOP
[CE 1.9]
I conducted Lab testing using a miniature prototype representing the actual 250 Km of pipeline. I modified the field devices provided by the Companyfor reduced flow and pressure conditions in lab. The setup included two gathering manifolds and the collection of data at a local Remote Terminal Unit (RTU) via fiber cable. The instruments were installed along the pipeline on specific locations including the manifolds and delivery stations
The Remote Terminal Units (RTU) transferred the data to a central location in real time using fiber optical cable. Pipelines was being controlled remotely from The Main Control Room. The pipeline control room used Programmable Logic Control PLC (SCADA system was designed to be used for the actual project) that returned real-time information about the flow rate, pressure, etc. The PLC received all the field data and presented me with the Human Machine Interface needed to control the hydraulic conditions of the pipeline and send operational commands like opening and closing of valves. The Cisco® ONS 15454 Multiservice Transport Platform was used in lab for the Optical system and was simulated using the software Optisystem Lite. The system comprised of wavelength division multiplexing technique.
[CE 1.10]
I performed the calculation for the minimum detection time of any alarms being triggered at the Central Control Unit. Based on this I calculated the distance in placement of the flow, pressure and temperature sensors based on the flow data provided from the Company.
If we are to assume
Flow rate of 56000 barrels per day and keeping a safety limit of 15 min detection time;
Since Flow= Cross Sectional Area X Velocity
It turns out that at a flow rate of 56000bbd, crude oil has a flow velocity of 4.184 ft/sec.
At this velocity and a time of 15min before shutdown translates to a distance of 1.147km between each sensing module.
A total of 250/1.147 = 217 sensors were required.
I carried out similar calculation for pressure and temperature sensors based on their minimum detection time + safety factor through the entire optical system.
[CE 1.11]
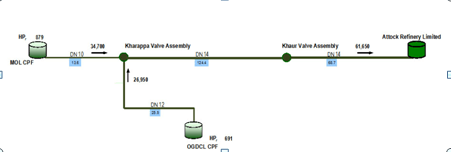
This project was already using a new technique being used first time in the oil and gas industry of Pakistan i.e. the use of fiber optic cable to transfer control data and providing remote surveillance of crude oil pipeline from a centralized location. The complete design comprised of control loops for regulation of the parameters. I designed the pump stations to stand at three nodes; MOL CPF, OGDCL CPF and an inter-system node at Kharappa Valve Assembly. The pressure, temperature and flow from all the valves along the pipeline and the regulatory action at the pumping stations were carried out over optic fibers which than connected the central control room (CCR) to the field devices and the stations.
Below is the Process and Instrumentation Diagram I made for the complete system which included all sensors and valve assemblies showing how they were connected to one central control room where the PLC controlled all operations and reported any alarms or faults if found:
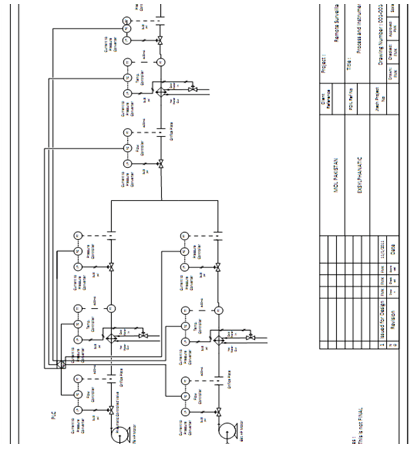
Fig: Draft P&ID
[CE 1.12]
This job was conducted on rig less operations. I performed proper job risk index and Hazard analysis as this placement was being done for the first time. I conducted pre-job safety meetingson the field before the initiation of the project to ensure that everybody understands job procedures and is well trained. Cement slurry was properly handled in steel batch mixers in order to avoid any spill of the slurry which could result in environmental hazard. This job required slurry to be pumped under high pressure of 5000 psi at surface. It was ensured that all equipment is rated to 10000 psi safe working pressure and has all the certifications are current and up to date.
[CE 1.13]
I was heading a team which included technical engineers, lab technicians and chemical management personnel. At the start of the project I analyzed weakness and strength of all the personnel and assigned objectives to everyone for the projects. I prepared key performance indicator of this project to monitor progress of all personnel on weekly basis. I ensured that all team members are equipped with fit for purpose training and tools to achieve their objectives. I had 15 minutes dailymeeting in the morning to discuss the project progress with team members and discuss any issues if faced by anyone. I personally worked with employees who were behind their schedules and ensured that they complete their tasks in time.
I gave presentations monthly to the head of departments at our university and to the concerned personnel at the company funding our project.
Topics of the presentation included:
A report was submitted at the end of the project timeline to the university and the company sponsoring our project. It included all the working done during the phases of the project and the post project documentation including documentation for system, user and maintenance manuals.
[CE 1.14]
Project was successfully completed. On the day of the final year project exhibition my project secured the second place amongst all the university projects. One year after the completion of the project the actual pipeline project was initiated and completed successfully within three years.
I applied my knowledge of Optical Communication and Instrumentation to design an effective system for remote surveillance of crude oil pipeline from a centralized location.
Working on this project I learnt and improved the design of cement slurry and how to reduce friction pressure while designing cement slurries. I also learned how to manage simultaneous operations of Coil tubing and Cementing.
As a Lead Design Engineer, I was following up with the complete Design, Execution and Evaluation of the project utilizing my field experience and trainings. I implemented all the procedures in the Cementing lab to simulate the impact of this job. I was the sole contact of the client and managing both teams of Coil tubing and Cementing.
I planned the complete logistics and execution plan for the job keeping in mind the safety and timeline of the project.
To read more.............. Kindly check the below links.
We hold the apex position in providing services regarding CDR writing for engineers Australia. We are known to have very high success records for consistent team of professional writers having years of experience in the field of CDR preparation. We provide the best and trusted service for CDR writing and reviewing of all kinds of engineering disciplines. We provide services for career episode writing, plagiarism check and removal etc.
Should you need any further information, please do not hesitate to contact us.
Contact: +61-4-8885-8110
WhatsApp: +61-4-8885-8110
(Australia, USA, UK, UAE, Singapore, New Zealand)